LogoLogo
4.1
4.1
  • Developer Documentation
  • Install HarperDB
    • On Linux
  • Getting Started
  • Full API Documentation
  • HarperDB Studio
    • Create an Account
    • Log In & Password Reset
    • Resources (Marketplace, Drivers, Tutorials, & Example Code)
    • Organizations
    • Instances
    • Query Instance Data
    • Manage Schemas / Browse Data
    • Manage Charts
    • Manage Clustering
    • Manage Instance Users
    • Manage Instance Roles
    • Manage Functions
    • Instance Metrics
    • Instance Configuration
    • Instance Example Code
    • Enable Mixed Content
  • HarperDB Cloud
    • IOPS Impact on Performance
    • Instance Size Hardware Specs
    • Alarms
    • Verizon 5G Wavelength
  • Security
    • JWT Authentication
    • Basic Authentication
    • Configuration
    • Users & Roles
  • Clustering
    • Requirements and Definitions
    • Creating A Cluster User
    • Naming A Node
    • Enabling Clustering
    • Establishing Routes
    • Subscription Overview
    • Managing Subscriptions
    • Things Worth Knowing
  • Custom Functions
    • Requirements and Definitions
    • Create a Project
    • Define Routes
    • Define Helpers
    • Host A Static Web UI
    • Using NPM and GIT
    • Custom Functions Operations
    • Restarting the Server
    • Debugging a Custom Function
    • Custom Functions Templates
    • Example Projects
  • Add-ons and SDKs
    • Google Data Studio
  • SQL Guide
    • SQL Features Matrix
    • Insert
    • Update
    • Delete
    • Select
    • Joins
    • SQL Date Functions
    • SQL Reserved Word
    • SQL Functions
    • SQL JSON Search
    • SQL Geospatial Functions
      • geoArea
      • geoLength
      • geoDifference
      • geoDistance
      • geoNear
      • geoContains
      • geoEqual
      • geoCrosses
      • geoConvert
  • HarperDB CLI
  • Configuration File
  • Logging
  • Transaction Logging
  • Audit Logging
  • Jobs
  • Upgrade a HarperDB Instance
  • Reference
    • Storage Algorithm
    • Dynamic Schema
    • Data Types
    • Content Types/Data Formats
    • HarperDB Headers
    • HarperDB Limits
  • Support
  • Release Notes
    • HarperDB Tucker (Version 4)
      • 4.1.0
      • 4.0.6
      • 4.0.5
      • 4.0.4
      • 4.0.3
      • 4.0.2
      • 4.0.1
      • 4.0.0
    • HarperDB Monkey (Version 3)
      • 3.3.0
      • 3.2.1
      • 3.2.0
      • 3.1.5
      • 3.1.4
      • 3.1.3
      • 3.1.2
      • 3.1.1
      • 3.1.0
      • 3.0.0
    • HarperDB Penny (Version 2)
      • 2.3.1
      • 2.3.0
      • 2.2.3
      • 2.2.2
      • 2.2.0
      • 2.1.1
    • HarperDB Alby (Version 1)
      • 1.3.1
      • 1.3.0
      • 1.2.0
      • 1.1.0
Powered by GitBook

© HarperDB. All Rights Reserved

On this page
  • Creating a New Chart
  • Downloading Charts
  • Delete a Chart
Export as PDF
  1. HarperDB Studio

Manage Charts

The HarperDB Studio includes a charting feature within an instance. They are generated in real time based on your existing data and automatically refreshed every 15 seconds. Instance charts can be accessed with the following instructions:

  1. Navigate to the HarperDB Studio Organizations page.

  2. Click the appropriate organization that the instance belongs to.

  3. Select your desired instance.

  4. Click charts in the instance control bar.

Creating a New Chart

Charts are generated based on SQL queries, therefore to build a new chart you first need to build a query. Instructions as follows (starting on the charts page described above):

  1. Click query in the instance control bar.

  2. Enter the SQL query you would like to generate a chart from.

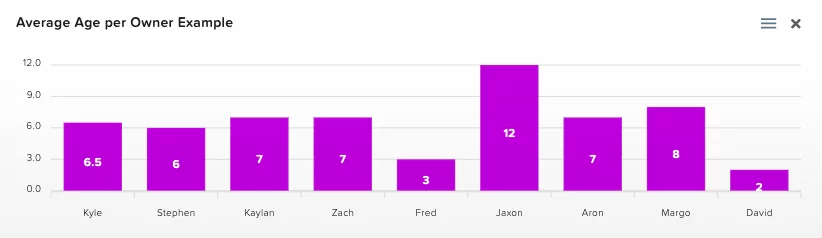
    For example, using the dog demo data from the API Docs, we can get the average dog age per owner with the following query: SELECT AVG(age) as avg_age, owner_name FROM dev.dog GROUP BY owner_name.

  3. Click Execute.

  4. Click create chart at the top right of the results table.

  5. Configure your chart.

    1. Choose chart type.

      HarperDB Studio offers many standard charting options like line, bar, etc.

    2. Choose a data column.

      This column will be used to plot the data point. Typically, this is the values being calculated in the SELECT statement. Depending on the chart type, you can select multiple data columns to display on a single chart.

    3. Depending on the chart type, you will need to select a grouping.

      This could be labeled as x-axis, label, etc. This will be used to group the data, typically this is what you used in your GROUP BY clause.

    4. Enter a chart name.

      Used for identification purposes and will be displayed at the top of the chart.

    5. Choose visible to all org users toggle.

      Leaving this option off will limit chart visibility to just your HarperDB Studio user. Toggling it on will enable all users with this Organization to view this chart.

    6. Click Add Chart.

    7. The chart will now be visible on the charts page.

The example query above, configured as a bar chart, results in the following chart:

Downloading Charts

HarperDB Studio charts can be downloaded in SVG, PNG, and CSV format. Instructions as follows (starting on the charts page described above):

  1. Identify the chart you would like to export.

  2. Click the three bars icon.

  3. Select the appropriate download option.

  4. The Studio will generate the export and begin downloading immediately.

Delete a Chart

Delete a chart as follows (starting on the charts page described above):

  1. Identify the chart you would like to delete.

  2. Click the X icon.

  3. Click the confirm delete chart button.

  4. The chart will be deleted.

Deleting a chart that is visible to all Organization users will delete it for all users.

PreviousManage Schemas / Browse DataNextManage Clustering

Last updated 1 year ago

Average Age per Owner Example